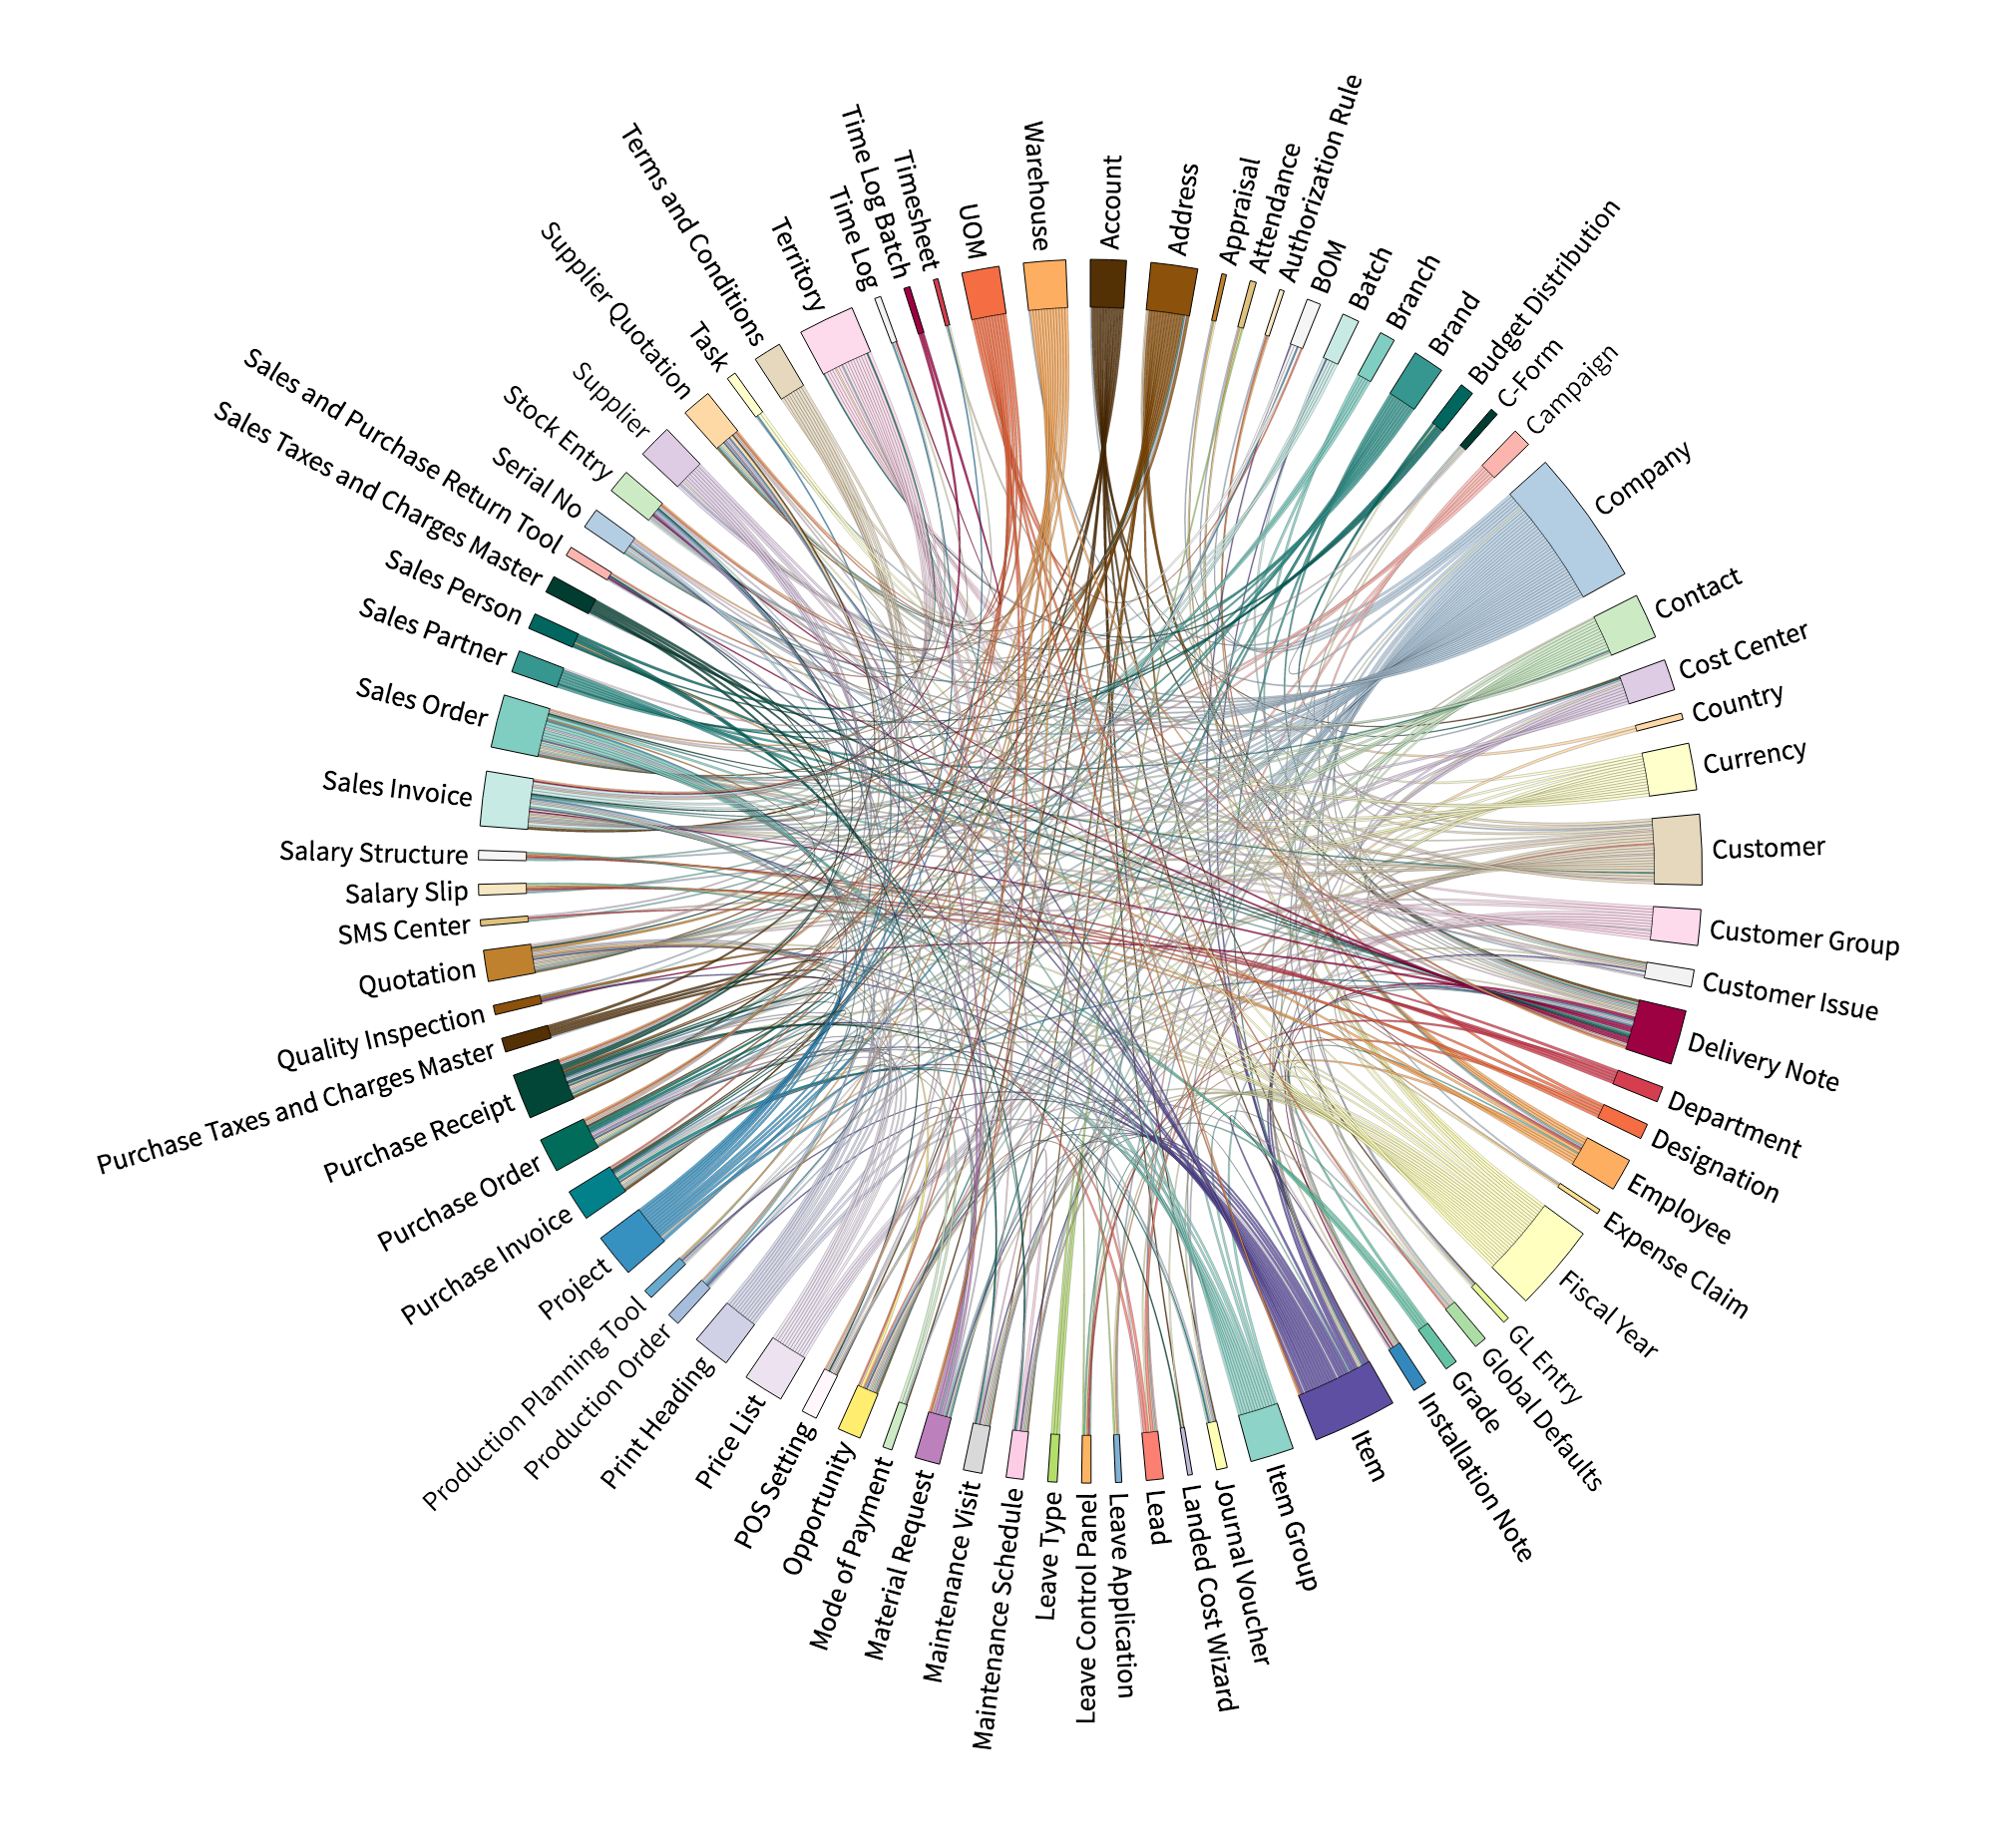
ERPNext is a highly complex product having more than 200 inter-connected tables (DocTypes). The visualization below shows relationship between 50 DocTypes selected based on the frequency of occurrence of its link. Click on the image below to interact with the visualization. If you hover the mouse on a particular DocType’s arc (box on circle’s rim), you will be able to view its relationships in isolation.
Curious on how this was created? Check out its source. The code has instructive comments.
This chord diagram was created using d3.js